gtag('event', 'conversion', {'send_to': 'AW-381971820/DhGeCPCgsKsZEOzakbYB'});

News

Election Outcome Presents Opportunity For Investors

As the November 2024 election draws near, the election outcome will profoundly affect the financial markets. Whether Donald Trump or Kamala Harris wins the presidency, each administration will bring distinct policies creating investment opportunities and potential risks for investors. With a divisive political landscape, it is crucial to understand how these potential outcomes can shape the stock market and your portfolio strategy.

Let’s break down the key sectors that stand to gain from a Trump or Harris presidency and explore the risks investors should be aware of heading into this election outcome.

Investment Opportunities in a Trump Presidency

Energy & Fossil Fuels

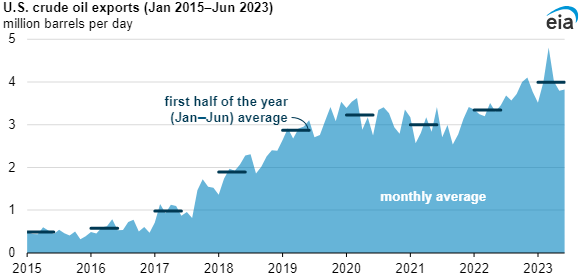
If Trump wins, that election outcome will likely favor the traditional energy sector, with policies designed to roll back regulations from the current Administration that have restricted oil and gas exploration. During Trump’s previous term, he aggressively pursued pro-energy policies, resulting in a boom for fossil fuel companies like ExxonMobil (XOM) and Chevron (CVX). As shown in the chart below from the U.S. Energy Information Administration, crude oil exports surged from 1 million barrels per day in 2017 to 3.5 million in 2020. During a second term, Trump’s emphasis on deregulation and energy independence could lead to a similar boost.

Investors should look for growth opportunities in large oil producers and service companies like Diamondback Energy (FANG), which directly benefit from increased production.

Crude oil exports

Defense and Aerospace

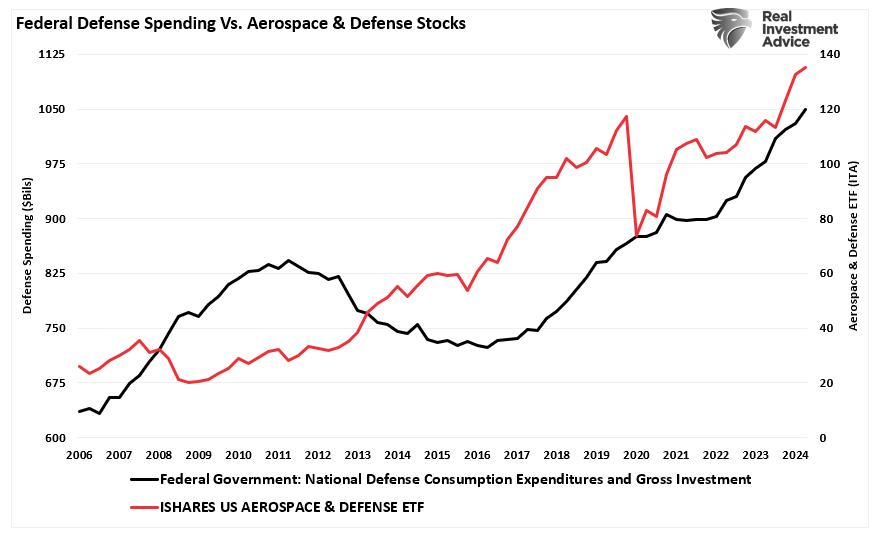
Defense spending is another area that would benefit from a Trump election outcome. Trump has been a strong proponent of increasing military spending to modernize and strengthen national security. Such policies historically benefited defense contractors such as Lockheed Martin (LMT) and Raytheon Technologies (RTX). These companies will likely see further government contracts and funding for military expansion, making them attractive investments. Given that defense spending increases in Democratic and Republican administrations, such will likely be the case again. Lastly, defense stocks are also typically defensive in uncertain market environments and are generally very stable dividend payers.

Federal Defense Spending vs Defense Stocks.

Financials and Banking

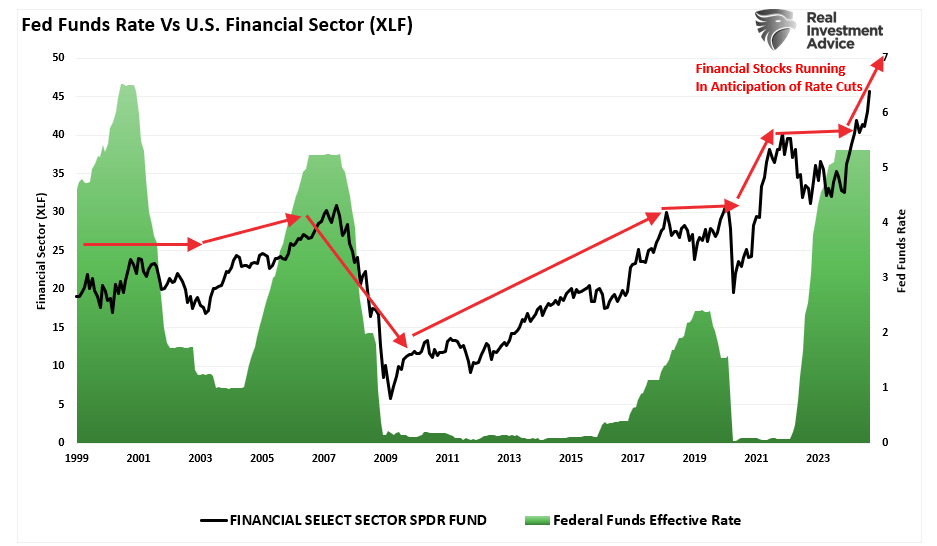
A Trump election outcome is also expected to favor the financial sector through further deregulation. Trump has already demonstrated a willingness to roll back restrictions imposed by Dodd-Frank, making it easier for financial institutions to operate with less oversight. This would benefit large banks such as JPMorgan Chase (JPM) and Goldman Sachs (GS). Howeverlarger regional banks like Truist Financial (TFC) and PNC Bank (PNC), which have struggled amid higher interest rates during the previous administration, would also benefit.

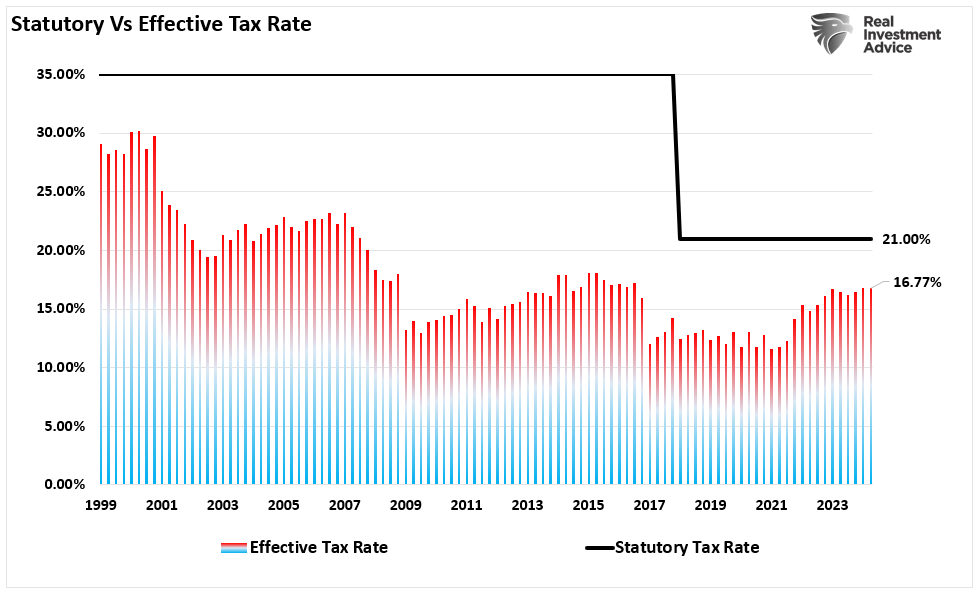
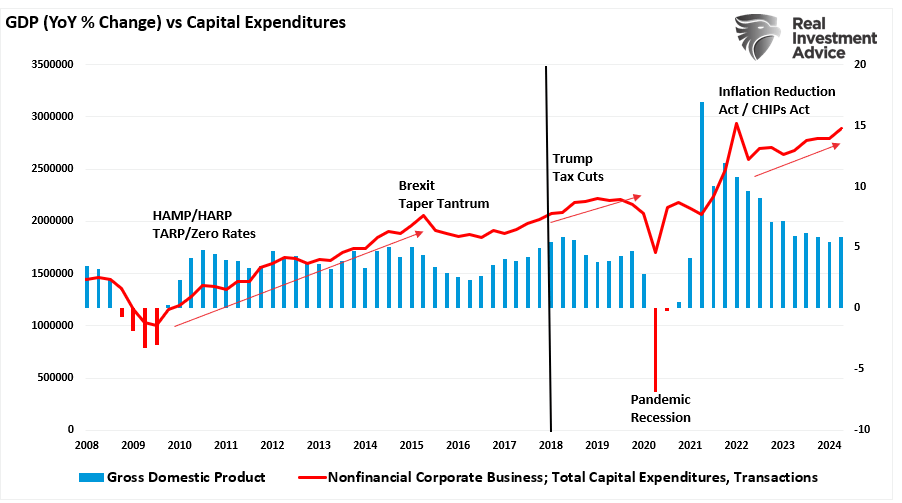
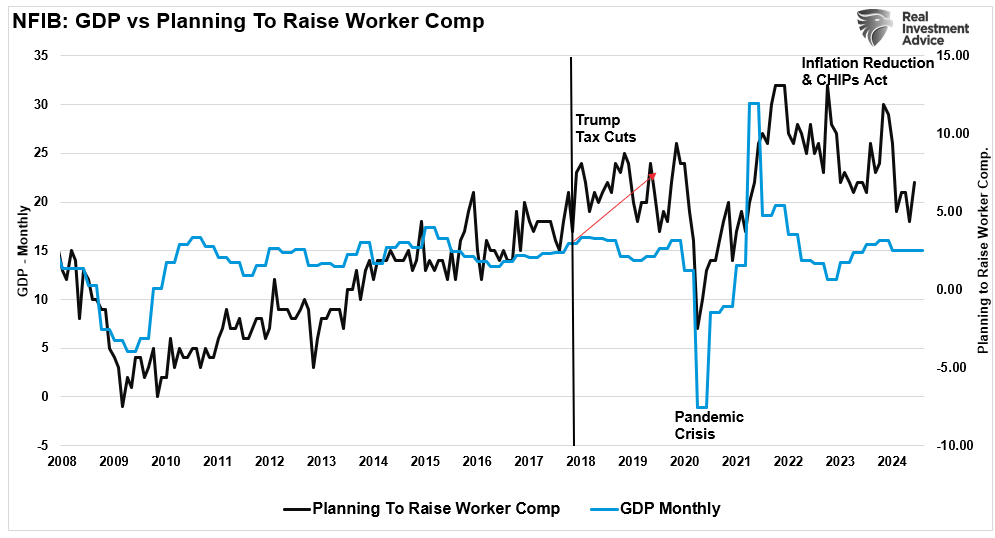
A stronger economy, reduced regulatory restrictions, and lower interest rates from the Federal Reserve would create higher profitability, reduced compliance costs, and less collateral impairment. Additionally, as discussed in “Tax Cuts And TCJA,” Trump’s policies may favor continued corporate tax cuts, boosting bank earnings and shareholder returns.

Fed funds rate vs Financial Sector

Investment Opportunities in a Harris Presidency

While Kamala is not the incumbent, she represents a likely continuation of the current administration’s policies.

Clean Energy and Sustainability

If Kamala Harris wins the election, it will likely create a tailwind for the clean energy sector. Following the Inflation Reduction Act, which allocated more than $800 billion to climate change-related projects, Harris will likely promote policies to increase investment in renewable energy sources. Companies involved in solar, wind, and energy storage, such as NextEra Energy (NEE), First Solar (FSLR), and Tesla (TSLA), would stand to benefit. However, it is notable that more than 100 solar-related companies have filed for bankruptcy in 2024, so investors must remain prudent about individual company fundamentals. Investors could consider clean energy ETFs, such as ICLN (iShares Global Clean Energy ETF), to gain exposure to a broad range of companies that could benefit from government subsidies, tax incentives, and infrastructure projects focused on sustainability.

Renewable energy market

Healthcare and Pharmaceuticals

Harris’s healthcare agenda is expected to focus on expanding access to healthcare, strengthening the Affordable Care Act, and implementing policies to reduce prescription drug prices. This could benefit both large pharmaceutical companies like Pfizer (PFE) and Johnson & Johnson (JNJ), as well as healthcare providers and insurers like UnitedHealth Group (UNH).

Additionally, with an increased focus on public health, biotech companies involved in innovative medical research and vaccine development could also experience growth. Investors should watch stocks related to healthcare services and medical device innovation.

Healthcare expenditures vs Healthcare sector

Technology and Innovation

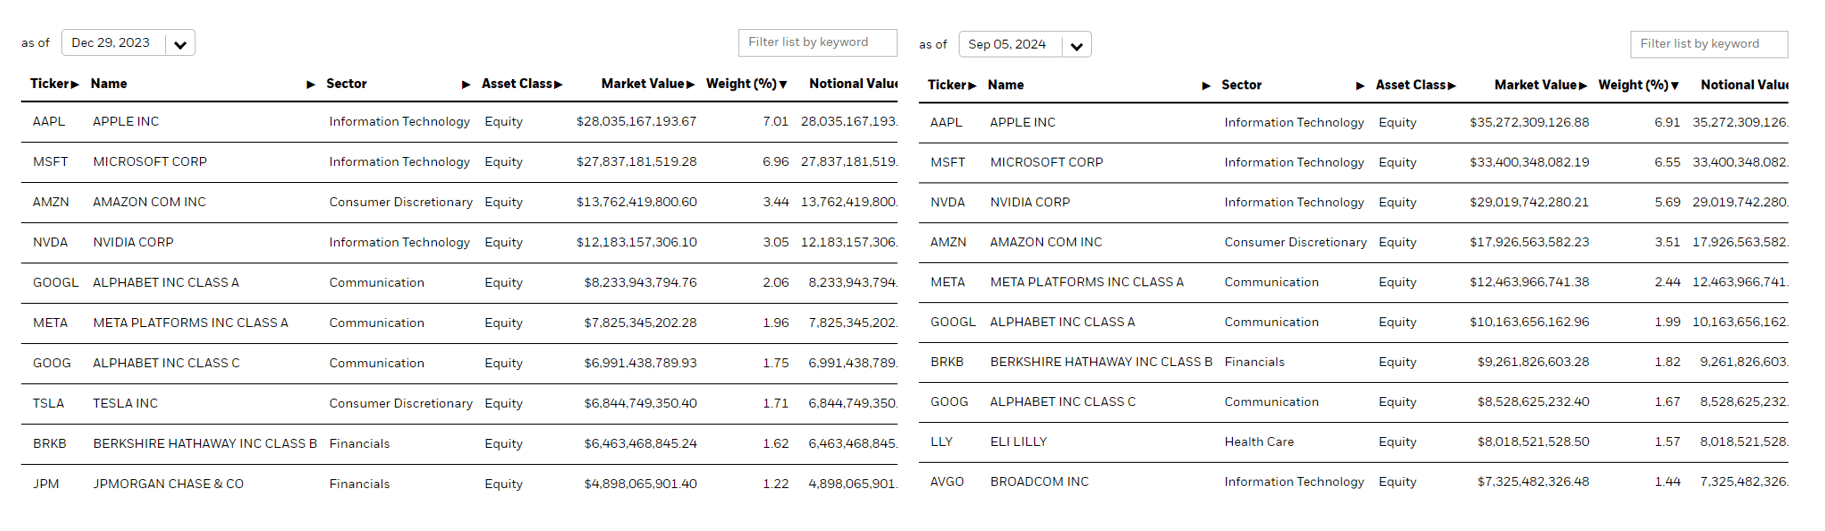
Harris has consistently supported advancing technology and innovation, particularly in artificial intelligence (AI), cybersecurity, and 5G infrastructure. Companies like NVIDIA (NVDA), Microsoft (MSFT), and Alphabet (GOOGL) are well-positioned to benefit from increased government support for technological infrastructure and research. With a Harris election outcome, investors can expect further investments in tech sectors that improve digital access and data privacy protections. This may also boost demand for cybersecurity solutions, benefiting companies specializing in this area. For further analysis, read our report on the coming demand for electricity needed by artificial intelligence.

A.I. Market Size

Ad for SimpleVisor. Don't invest alone. Tap into the power of SimpleVisor. Click to sign up now.

Conclusion: Risks and How to Mitigate Them

Regardless of who wins, the election outcome presents certain risks that investors must consider. Election years often bring increased volatility, and this cycle is no exception. Here are the key risks and strategies to manage them:

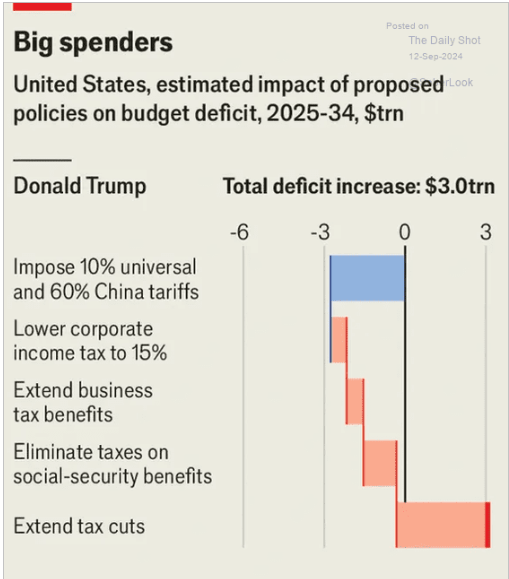
  • Tax Policy Uncertainty: A Harris presidency could bring corporate tax hikes, which may negatively impact the profitability of tech and financial companies. In contrast, a Trump presidency may lower taxes but could lead to growing deficits and potential inflationary pressures. Investors should stay informed of potential tax changes and consider shifting some assets to tax-advantaged accounts or dividend-paying stocks to cushion against negative impacts.
  • Interest Rate and Inflation Risks: Both administrations will face challenges managing inflation and interest rates. As the Federal Reserve cuts rates, there is a risk of a resurgence of inflation. Investors should consider diversifying into sectors less sensitive to rate changes and focus on fundamentals and dividend payout histories.
  • Healthcare Sector Volatility: A Harris administration may introduce new healthcare regulations that could compress margins for some pharmaceutical companies. While expanded healthcare access could benefit healthcare service providers, introducing pricing controls could create downside risks for drug manufacturers. Investors should maintain a diversified exposure to the healthcare sector, balancing risk with potential gains from policy-driven expansion.

How to Protect Your Portfolio

  • Diversification: Spreading investments across sectors that could perform well under either administration—like clean energy, defense, and healthcare—can help mitigate risks tied to the election outcome. Maintaining a balance between growth stocks and defensive sectors can help weather volatility.
  • Dividend-Paying Stocks: Companies with strong dividend histories, like Procter & Gamble (PG) and Coca-Cola (KO), can provide income during market uncertainty and reduce portfolio volatility.
  • Follow Your Risk Management Discipline: As we often discuss, a healthy regime of taking profits, rebalancing portfolios, moving up stop-loss levels, and increasing cash balances can help mitigate portfolio risk during periods of uncertainty.

I have no idea how the election will turn out in November. However, like every election outcome, investors will have opportunities and face risks. Whether it’s Trump’s pro-energy and defense stance or Harris’s focus on clean energy and healthcare, positioning your portfolio for the post-election market requires careful consideration. Staying diversified, preparing for volatility, and managing risks will be key to navigating whatever outcome lies ahead.


Disclosure: RIA Advisors has positions in most or all of the specific stocks and ETFs mentioned in this article for its clients. This discussion is not a recommendation to buy or sell anything, and RIA Advisors may or may not own some of these positions at the time of publication. In no way should any of the information in this informational blog be considered a recommendation, solicitation, or advertisement. This blog is for educational and informational purposes only; past performance does not guarantee future results.

The post Election Outcome Presents Opportunity For Investors appeared first on RIA.

A Crystal Ball Isnt Enough: The Importance Of Context

On September 18, 2024, the headlines read the Fed cut the Fed Funds rate by 50 basis points. At first blush, one would think that a trader with a crystal ball a couple of days before the Fed action would buy bonds and lick their chops over the money they would soon make. In this case, the crystal ball was a curse.

Bond yields rose following the rate cut despite what many investment professionals perceive to be a bullish event. If you scour the media, you will find rationales for the sell-off. Such includes the Fed stoking inflation or China’s massive stimulus package. In our opinion, it’s much more straightforward; it all comes down to context.

We were inspired to write this by a message asking us in disbelief if we had ever seen such an adverse bond market reaction to a rate cut.

To help answer the question, we share an article entitled When A Crystal Ball Isn’t Enough To Make You Rich by Victor Haghani and James White, along with their Crystal Ball Challenge. The article and challenge help us appreciate that context is often more valuable than a crystal ball.  

Ad for financial planning services. Need a plan to protect your hard earned savings from the next bear market? Click to schedule your consultation today.

Technicals Provide Context

On September 18, when the Fed cut interest rates by 50bps, ten-year note yields rose slightly from the opening yield of 3.68% to close the day at 3.69%. Five days later, the yield rose another .12% to 3.81%.

A crystal ball enlightening a trader about the rate cut headlines would have been costly. However, a trader with the crystal ball and proper context may have been more successful. In trading, context describes market conditions and recent trends. On a short-term basis, excellent context can be gleaned from technical analysis.

To contextualize the Fed rate cuts, investors had been expecting a rate cut at the September meeting for months. Furthermore, in the days leading up to the announcement, the odds of a 50bps rate cut increased markedly. The critical context was the 1% decline in ten-year note yields since April, and, equally importantly, bond prices were extremely overbought on a technical basis.

This potential for a bearish reaction to what should have been positive news from the Fed was not lost on us. On September 17, the day before the meeting, we wrote the following summary on bonds in our Daily Commentary:

Yesterday, we discussed the market’s strong rally from the recent lows. However, the bond market has rallied just as strongly ahead of this week’s highly anticipated Federal Reserve meeting and the expected rate cut. As shown, Treasury bonds (as represented by TLT) are quite deviated from the 50-DMA and overbought on multiple levels. While we remain bullish on bonds in the longer term, particularly as the economy slows, the current overbought conditions and “exuberance” into the bond trade over the last few months is a bit overdone.

With the Fed meeting this week, the current setup suggests that even if the Fed cuts rates as expected, this could be a “buy the rumor, sell the news” setup for bonds. Of course, as is always the case, overbought conditions can remain overbought longer than most imagine, so trade accordingly.

To subscribe to our Daily Commentary free of charge to your email every morning, click HERE.

With that example of how context was more valuable than a crystal ball, we let you discover the value of a crystal ball without any context.

The Crystal Ball Challenge

The article noted in the introduction is based on information the authors gleaned by subjecting over 118 young adults schooled in finance to the Crystal Ball Challenge.

Before summarizing the article, click on the crystal ball below. Take the challenge and see what value, if any, a crystal ball with tomorrow’s headlines is in predicting short-term price changes. (LINK)

crystal ball challenge

Ad for The Bull/Bear Report by SimpleVisor. The most important things you need to know about the markets. Click to subscribe.

Review: When A Crystal Ball Isn’t Enough To Make You Rich

Per the whitepaper:

Was Taleb correct in his conjecture that “If you give an investor the next day’s news 24 hours in advance, he would go bust in less than a year”? While our experiment didn’t test his statement precisely – we only gave players 15 days of front pages, players were risking just $100 in the game, etc. – by and large we think Taleb is right.

The 118 young finance professionals posted a meager positive return. Their results were not statistically different than flipping a coin. They attribute the poor results to two factors.

The first was not correctly guessing how stocks and bonds would perform with knowledge of the headlines 36 hours in advance.

Second, the authors claim the players didn’t properly size their bets. We also presume that some traders made trades on headlines that did not affect the markets. In those cases, it was a 50/50 proposition.

Sizing is an important point the authors stress. Trade sizes should have been minimal, or trades should not have occurred when the trader had little confidence their guess was correct. Conversely, they should have had larger sizes when they had more confidence. 

Experience Matters

The article shares a tweet from the very experienced Lloyd Blankfein, ex-Chair of Goldman Sachs. While he tweets about the market action concerning CPI on one specific day, we bet he would agree that, generally, having news before everyone else may not be all it’s cracked up to be.

lloyd blankfein crystal ball

After testing the younger finance professionals, the authors wanted to see how experienced traders would do. They “invited five seasoned and successful macro traders” to take their test. Once again, they found that advanced knowledge of headlines was not incredibly valuable. The traders got 63% correct. However, they posted an average return of 130%.

These players all finished with gains. On average, they grew their starting wealth by 130%, with a median gain of 60%. All of the players were selective and highly variable in their trade-sizing. They did not bet at all on about 1/3 of the trading opportunities, but bet big on days when they presumably felt confident in the impact of the news on stock or bond prices.

Guessing is a fool’s errand when it comes to investing. However, investing with context and adequately sizing your trades/investments based on your confidence level is vital.

The study, in a roundabout way, shows that context matters. As we opined in the opening, technical analysis can provide significant context as to recent trends, the strength of said trends, and how momentum may change. Furthermore, volume and trade analysis can help us find market pain points and price levels where investors are more likely to buy or sell.

Macroeconomic analysis and appreciation for the liquidity situation of a market are also essential to help bolster your context. Along the same lines, given the importance of actual and perceived liquidity, a good appreciation for the Fed’s current mindset and their current and likely stance on monetary policy is critical.

With proper context, a headline in your crystal ball may prove much more valuable.

Ad for SimpleVisor. Get the latest trades, analysis, and insights from the RIA SimpleVisor team. Click to sign up now.

Summary

A crystal ball would be an excellent addition to our market analysis arsenal. Advanced knowledge of market, economic, political conditions, and other events would likely positively impact our performance. The impact, however, would be over the longer run, not in the returns immediately following the foreseen events. Trading on a short-term basis with no context can be hazardous to your wealth.

Furthermore, assumptions of a specific result due to particular news are often faulty. As the old saying goes- buy the rumor, sell the news!

The post A Crystal Ball Isnt Enough: The Importance Of Context appeared first on RIA.

The “Everything Market” Could Last A While Longer

We are currently in the “everything market.” It doesn’t matter what you have probably invested in; it is currently increasing in value. However, it isn’t likely for the reasons you think. A recent Marketwatch interview with the always bullish Jim Paulson got his reasoning for the rally.

“It is this cocktail of ‘full support’ at the front end of a bull market which commonly has created an ‘Everything Market’ during the early part of a new bull. That is, for a period, almost everything simultaneously rises – value, growth, small, large, defensive, and cyclical stocks – and usually by a lot.

Short rates are falling, bond yields have declined, money growth is rising, fiscal stimulus has again expanded, and disinflation is still evident; and because of this new and overwhelming support, expectations for a soft landing should grow while both consumer and business confidence improves.”Jim Paulson

Everything market

But that isn’t the reason.

On the other side of the bull/bear argument are “gold bugs” enjoying soaring gold prices because “debts and deficits” are finally eroding the U.S. economy. As Michael Hartnet of BofA recently stated:

Long-run returns in commodities are rising after the worst decade since the 1930s, led by gold, which is a hedge against the 3Ds: debt, deficit, debasement.”

The evidence doesn’t support that view. Historically, when deficits as a percentage of GDP increase, gold does very well as concerns about U.S. economic health increase (as per Michael Hartnett of BofA.) However, gold performs poorly as economic growth resumes and the deficit declines. Such is logical, except that since 2020, gold has soared in price even as economic health remains robust and the deficit as a percentage of GDP continues to decline.

Debt as percent of GDP vs Gold

While stocks and gold have risen this year, bonds, commodities, real estate, and cryptocurrencies have also enjoyed gains.

Chart comparison of YTD price performance of various asset classes

In other words, whatever your “thesis” is for whatever asset you own, the price action currently supports that thesis. That does not mean your thesis is correct.

In an “everything rally,” rising asset prices cover investing mistakes.

Therefore, this analysis should elicit two important questions: 1) what drives the “everything rally,” and 2) when will it end?

Whatever Your Thesis Is – It’s Probably Wrong

When it comes to what is driving the “everything rally,” everyone has their thesis. The “stock jockeys” suggest that easier monetary accommodation by the Fed and improving earnings are the key drivers for equities. As noted above, the “gold bugs” are seduced by burgeoning government spending and expectations of a dollar decline to loft gold prices higher. Every asset class has its “reason” for going higher, but the real reason may be much simpler. This post will focus on stocks and gold as they garner the most headlines and have the most fervent of “true believers.”

In every market and asset class, the price is determined by supply and demand. If there are more buyers than sellers, then prices rise, and vice-versa. While economic, geopolitical, or financial data points may temporarily affect and shift the balance between those wanting to buy or sell, in the end, the price is solely determined by asset flows.

Notably, the amount of money flowing into assets has been remarkable since 2014. Despite many “concerns,” 2024 is on track to be the second-strongest year of monetary inflows since 2021. That statistic is amazing when considering the government was flooding the system with trillions in monetary and fiscal stimulus then versus contracting it currently.

Money flows by year

Unsurprisingly, as asset prices increase during the “everything market,” more money is pulled into those assets, forcing prices to rise as demand outstrips supply. As we noted previously, for “every buyer, there is a sellerat a specific price.” That “demand” for stocks, gold, real estate, cryptocurrencies, etc., comes from many sources.

  1. Hedge funds
  2. Private equity funds
  3. Corporate share buyback programs
  4. Passive indexes
  5. Pension funds
  6. Institutional funds
  7. Mutual Funds
  8. Retirement plans
  9. Global investors
  10. Retail investors

Most important is the supply of capital from Central Banks.

Global money supply.

Of course, a massive accumulation of cash in money market funds will face declining yields as the Federal Reserve cuts interest rates.

Money market funds bs Fed funds

As noted, whatever your “thesis” for owning an asset probably isn’t the actual reason. There are three primary reasons why asset prices are rising in the “everything market.”

  1. Liquidity
  2. Liquidity
  3. Liquidity

In other words, in an “everything market,” there is too much money chasing too few assets.

Aggregate asset allocation

As noted, “money flows” are the “demand side” of the equation. As previously discussed, the “supply side,” or the amount of “assets available,” continues to decline. Such explains why managers continue to “chase stocks” despite high valuations.

“The number of publicly traded companies continues to decline, as shown in the following chart from Apollo. This decline has many reasons, including mergers and acquisitions, bankruptcy, leveraged buyouts, and private equity. For example, Twitter (now X) was once a publicly traded company before Elon Musk acquired it and took it private. Unsurprisingly, with fewer publicly traded companies, there are fewer opportunities as market capital increases. Such is particularly the case for large institutions that must deploy large amounts of capital over short periods.”

Number of publicly listed U.S. companies

The same is true for gold. While the demand for gold increases as prices rise, the supply of gold has declined since 2019.

Gold production by year

As such, gold is no longer a “risk-off ” asset with a negative correlation to equities but is now a risk-on asset, just like equities. The 4-year correlation to the S&P 500 is near previous peaks, with subsequent performance.

Gold vs correlation to stocks

Of course, these “everything markets” can last much longer than logic suggests. However, they do end. What causes “everything markets” to end is whatever exogenous, unexpected event turns off the flow of liquidity.

Ad for SimpleVisor. Don't invest alone. Tap into the power of SimpleVisor. Click to sign up now.

Technically Speaking

As noted, “everything markets” can last longer than logic dictates. However, they eventually end, and we don’t know what will cause it or when. Take a look at the two charts below.

In each chart, I have denoted periods where three factors occurred:

  1. The market traded at 2-or more standard deviations above the 4-year moving average
  2. Relative Strength was overbought on a long-term basis
  3. The MACD was elevated and triggering a “sell signal.”

Technical monthly chart of stocks

Technical monthly chart of gold

In both cases, these technical extremes marked short to long-term corrections and consolidations for stocks and gold. For the S&P 500 index, these periods also corresponded to more important headline events such as the “Crash of 1987,” the “Dot.com Crash,” and the “Financial Crisis.” Notably, like the S&P 500, the technical deviations for gold are also at levels that have denoted short to long-term corrective cycles.

As Paulsen noted in his interview, “everything markets” typically last only six months to a year. He expects this one to be in force at least for “the next several months.”

“Although the road ahead, even if some of my thinking proves correct, will still be interrupted by regular bouts of volatility, investors may want to consider staying bullish during the next several months, finally enjoying a mini restart to this bull market and perhaps witness what full support can do for your portfolio.”

We have no idea what will eventually cause a shift in liquidity as the Federal Reserve and global central banks move back into easing mode. (The monetary conditions index combines interest rates, the dollar, and inflation. It is inverted to correspond to rising asset prices.)

Monetary conditions index

Critically, September was the biggest month of monetary easing since April 2020 amid the global pandemic crisis.

Monetary easing

Notably, an eventual reversal could be caused by a “crisis event” or a reversal of monetary flows. The technical analysis tells us that it will occur and likely when the fewest investors expect it.

But that isn’t today.

Of course, this is always the case, so investors regularly “buy high and sell low.”

Remember Warren Buffett’s famous words when investing in an “everything market.”

“Investing is a lot like sex. It feels the best just before the end.”

Of course, maybe that is why Warren has been raising a lot of cash lately.


That’s it for today! If you want more insights like these, subscribe to our newsletter for regular updates on market trends and investing strategies.

The post The “Everything Market” Could Last A While Longer appeared first on RIA.

Tax Cuts – An Examination Of The 2017 TCJA Impact

An analysis of Presidential Candidate Trump’s policy proposals recently suggests that tax cuts will increase the deficit. While the raw analysis is correct, as it subtracts the potential for reduced tax collections from the tariff revenue, it ignores the impact on economic growth.

Estimate of proposed tax reform by Presidential Candidate Donald Trump

There is much rhetoric about the impact of tax cuts, mostly centering around “only benefitting the rich.” While it may seem that “the rich” are the ones who benefit, there are two important points to consider. First, the rich” already pay most of the taxes. The Tax Foundation shows that the top 10% of income earners paid 59.1% of taxes. The top 25% of income earners comprised nearly 70% of all tax revenue, with the top 50% paying 97% of all taxes.

Who pays the most in taxes

Of course, such begs the question of those claiming the “rich should pay their fair share” what that fair share is.

Secondly, due to the complexities of the current tax code, there is a significant difference between the “statutory” tax rate and what corporations pay (the effective rate). In 2018, the effective corporate tax rate was reduced to 21%, yet at the time, the actual tax rate paid was around 14%. Today, despite no change to the statutory rate, the effective tax rate has risen to almost 17%.

Statutory vs effective tax rate

Notably, changes to the statutory rate are far more symbolic than actual. However, employers experience a strong psychological impact when tax rates are changed. Increases in tax rates often lead to companies’ defensive posturing to offset the impact of higher taxes. Decreases in tax rates, while there may be very little impact on the effective rate, tend to provide economic benefits.

3-Examples The Economic Benefit Of Corporate Tax Cuts

Corporate tax rate reductions have long been a cornerstone of economic policy discussions in the United States. Proponents argue that reducing corporate taxes can stimulate investment, create jobs, and enhance the country’s global competitiveness. Critics often claim that such tax cuts primarily benefit large corporations and wealthy shareholders, with limited trickle-down effects on the broader economy. There is certainly truth in that statement. As we argued previously, corporate tax cuts often find their way into enriching corporate executives

However, this article explores the three key economic benefits of corporate tax rate reductions supported by real-world examples. Let’s begin with one of the most significant benefits: a boost to capital investment. With lower tax burdens, companies retain more profits, which can be reinvested into expanding operations, developing new technologies, and conducting research and development (R&D). These investments improve productivity, drive innovation and foster long-term economic growth.

Example 1: The Tax Cuts and Jobs Act of 2017

A prominent example of the relationship between corporate tax reductions and increased investment is the Tax Cuts and Jobs Act (TCJA) of 2017. The TCJA slashed the U.S. federal corporate tax rate from 35% to 21%, creating a more favorable environment for business investment. In the aftermath, several major corporations announced significant capital investments in the U.S. economy. Following those tax cuts, capital expenditures grew until 2019 as the economy started worrying about the pandemic and the shutdown.

GDP vs CapEx

A good example was Apple, which committed to investing $350 billion in the U.S. over five years, with a portion of the investment attributed to the savings from the tax cuts. This included plans for a new campus, data centers, and technology infrastructure to further drive innovation in artificial intelligence and 5G technology.

Additionally, the TCJA spurred investment across various sectors, particularly in manufacturing and energy, where companies used their tax savings to modernize facilities, adopt new technologies, and expand production capacity. However, the onset of the pandemic and subsequent massive monetary interventions have obscured the longer-term effects of the tax cuts.

2. Job Creation and Wage Growth

Corporate tax cuts can also lead to job creation and wage growth. When companies reinvest their tax savings into business expansion, they often need to hire more workers to support the growth. Additionally, businesses may pass some of their tax savings to employees through higher wages, bonuses, or enhanced benefits. Again, that happened in the short run, particularly in small and mid-sized businesses. However, as noted, the pandemic-related crisis confounded the longer-term effects.

Wages vs GDP

Example 2: Walmart’s Wage Increases and Bonuses

Following the TCJA’s enactment, Walmart, the largest private employer in the U.S., announced it would raise its starting wage to $11 per hour and provide bonuses of up to $1,000 to more than a million employees. While Walmart’s decision was partially driven by a competitive labor market, the company explicitly credited the tax cuts as a factor in its ability to increase wages and offer bonuses.

Walmart’s actions underscore the potential for corporate tax reductions to positively impact employees. By lowering tax liabilities, companies have greater flexibility to reward their workforce through wage increases, bonuses, or improved benefits. As discussed in “Labor Market Impact.” increased wages stimulate consumer spending, a critical driver of economic growth.

Beyond individual companies, studies have shown that reductions in corporate tax rates can have a broader positive impact on wages. According to the National Bureau of Economic Research, a one percentage point reduction in corporate tax rates can lead to a 0.5% wage increase over the long term. This is especially true in industries where businesses are highly profitable and can pass on some of their tax savings to employees. Although the effects are often more gradual, corporate tax cuts can support wage growth across various sectors.

Ad for SimpleVisor. Get the latest trades, analysis, and insights from the RIA SimpleVisor team. Click to sign up now.

3. Enhanced U.S. Competitiveness in a Global Economy

In the era of globalization, corporate tax rates play a crucial role in determining a nation’s ability to attract and retain businesses. High corporate tax rates can make a country less competitive compared to others with lower tax rates, potentially driving businesses to relocate operations abroad. By reducing corporate tax rates, the U.S. can enhance its attractiveness to domestic and foreign corporations, encouraging investment and job creation within its borders.

Example 3: Repatriation of Foreign Profits After the TCJA

The Tax Cuts and Jobs Act included provisions encouraging U.S. companies to repatriate overseas profits. Before the TCJA, U.S. corporations faced high taxes on foreign earnings, which led many companies to keep profits offshore rather than bringing them back to the U.S. The TCJA’s shift to a territorial tax system and a one-time tax on repatriated profits led to a significant influx of capital returning to the U.S.

According to the U.S. Bureau of Economic Analysis, U.S. companies repatriated more than $664 billion in foreign profits in the year following the tax reform. That capital repatriation significantly boosted the U.S. economy, with many companies using the funds to pay down debt and invest in domestic operations. They also used the capital to boost stock buybacks and issue dividends. Again, as noted, while there may have been longer-term benefits, the pandemic-related crisis cut them short.

GDP Annual Growth Rates

Notably, the TCJA made the U.S. a more attractive destination for business investment by aligning the corporate tax rate more closely with other developed nations. This has been particularly important in industries such as technology and pharmaceuticals, where companies weigh corporate tax rates heavily when deciding where to base their operations. For example, Pfizer, one of the largest pharmaceutical companies in the world, explicitly mentioned the positive effects of the U.S. tax reform on its global competitiveness and financial strategy.

Conclusion

Corporate tax rate reductions in the United States have delivered tangible economic benefits, including increased capital investment, job creation, wage growth, and enhanced global competitiveness. The Tax Cuts and Jobs Act of 2017 is a key example of how reducing corporate tax rates can stimulate economic activity. Companies like Apple, Walmart, and Pfizer have used their tax savings to reinvest in the U.S. economy, create jobs, raise wages, and bolster their global standing.

While the long-term effects of corporate tax cuts continue to be debated, there is no denying that, when implemented strategically, they can positively impact the broader economy. Furthermore, following the TCJA, tax receipts increased even though tax rates declined. Such is expected if the economy benefits from tax cuts. However, as noted above, those benefits were cut short by the onset of the pandemic and confounded by the massive interventions following.

As the U.S. continues to navigate global economic challenges, corporate tax policy will remain important for encouraging business investment, job creation, and sustained economic growth.

Tax policies of the next administration will play a key role in the economy and markets going forward.


Sources:

  1. Apple Announces $350 Billion Contribution to U.S. Economy After Tax Cuts: CNBC
  2. Walmart Raises Wages Following U.S. Corporate Tax Cut: USA Today
  3. U.S. Companies Repatriate $664 Billion After TCJA: U.S. Bureau of Economic Analysis

The post Tax Cuts – An Examination Of The 2017 TCJA Impact appeared first on RIA.

Agency REITs For A Bull Steepener

In our recent two-part series on the yield curve (Part One  Part Two) we discussed the four predominant yield curve shifts and what they imply about economic activity and monetary policy. Additionally, given the current bullish steepening trend of the yield curve, we provided data on how prior bull steepening environments impacted various stock indexes, sectors, and factors. Missing from our analysis was a discussion of a specific type of REIT whose valuations are well correlated with the shape of the yield curve. If you are buying this bull steepener, agency REITs are worth your consideration.

What is an Agency Mortgage REIT?

REITs own, manage, or hold the debt on income-producing properties. REITs must pay out at least 90% of their taxable profits to shareholders annually. This unique legal structure makes investment analysis of REITs different than most companies. REIT investors must analyze how changing economic, financial market, and monetary policy conditions affect the interplay between their underlying assets and liabilities.

Within the REIT category are a subclass investors call agency REITs. These companies own mortgages on residential real estate. Furthermore, as connotated by the word “agency,” most of the mortgages are secured and guaranteed against default by government agencies such as Fannie Mae, Freddie Mac, and Ginnie Mae. These securities are called Mortgage-Backed Securities (MBS). Because the U.S. government owns the agencies, MBS is essentially free of credit risk.

Ad for financial planning services. Need a plan to protect your hard earned savings from the next bear market? Click to schedule your consultation today.

How Agency REITs Make Money

Agency REIT earnings primarily come from three sources: the spread between the assets and liabilities (mortgage yield and debt), hedging costs, and the amount of leverage employed. 

Hypothetically, let’s start a new agency REIT to help you appreciate how they operate.

  • We solicit $1 billion from equity investors.
  • A significant portion of the $1 billion is used to buy mortgage-backed securities (MBS).
  • We then borrow $4 billion from a bank using the $1 billion of MBS as collateral.
  • The proceeds from the $4 billion loan also purchase MBS.
  • Our new REIT has about $5 billion of MBS against $1 billion of equity and $4 billion of debt.
  • As a result, the REIT has 5x leverage.

Assuming our mortgages pay 6% and our debt costs 4%, we can make $140 million a year, equating to a 14% return for our equity holders. That handily surpasses the 6% return if leverage wasn’t employed.

The math is relatively simple. On the $1 billion of MBS funded with equity, the REIT will make 6% or $60 million. On the $4 billion of MBS funded with debt, the REIT will earn the 2% difference between the MBS and the debt, or $80 million. The total earnings of $140 million divided by the $1 billion equity stake equals 14%.

Unfortunately, managing an agency REIT is not nearly as simple as we illustrate.

The Complexities Of Agency REIT Portfolio Management

MBS are a unique type of bond. The mortgagors, homeowners, can partially or fully pay down their mortgages whenever they want. As a result of the unique prepay option, the duration of MBS varies significantly with mortgage rates. At the same time, the duration of a REIT’s liabilities are much more stable. Accordingly, the portfolio managers take on duration mismatch risk. 

The following chart shows the duration of a Fannie Mae MBS originated in 2021. The weighted average mortgage rates of the underlying loans in the MBS are 3.36%. When rates started rising rapidly in 2022, the mortgagors had no incentive to prepay their loans. As a result, the duration of this MBS rose by 2.50 years. Since then, the duration has fallen with mortgage rates, as the odds of prepayments have increased. A duration change of 2.50 years may not seem like a lot, but when leverage is used, such a change can result in a relatively large duration mismatch and significant gains or losses.

Duration of a 2021 mbs

Because the duration of our MBS varies and our liabilities are relatively constant, agency REITs are constantly hedging duration risk. Furthermore, the yield spread between MBS and Treasuries introduces spread risk. The more a REIT hedges to minimize potential duration mismatches or spread risk, the less risk they take. But the hedging costs eat into profits. Lesser hedging can produce more profits but poses more significant risks.

Ad for The Bull/Bear Report by SimpleVisor. The most important things you need to know about the markets. Click to subscribe.

A Steeper Yield Curve Should Help REITs

Like banks, most agency REITs borrow for shorter terms than the duration of their assets. Creating such a mismatch in a positively sloped yield curve can result in additional profits as borrowing costs are less than asset yields. 

If the bull steepener yield curve trend continues, agency REIT MBS should gain value. However, the duration of the MBS will shrink due to prepayments. New MBS replacements will have lower yields. However, funding costs should decline. There are many moving parts to consider. While the environment is conducive for profits, as we noted earlier, the performance of agency REITs comes down to hedging accumen.

Several agency REITs are worth exploring, but for demonstration purposes, we focus on the oldest and largest public agency REIT, Annaly Capital Management (NLY). (Disclosure: RIA Advisors has a position in NLY in its client portfolios.)

The graph below compares NLY’s book value per share with the 10/2-year yield curve. The gray bars highlight the last five persistent bull steepener periods. Its book value and the yield curve track each other closely. The high correlation is shown in the second graph.

nly book value per shares vs yield curve

nly book value per shares vs yield curve

NLY’s BV per share has risen during bull steepeners, except for 2020.

NLY has averaged a 19% return during the five latest bull steepeners. That beats every other equity asset in the graph below, except for gold miners.

asset returns during bull steepeners

Ad for SimpleVisor. Get the latest trades, analysis, and insights from the RIA SimpleVisor team. Click to sign up now.

No Guarantees

While NLY has done well during bull steepeners on average, it did lose 30% during the pandemic. As such, we shouldn’t take the yield curve environment for granted. However, the rare nature of the pandemic resulted in hedging difficulties due to volatile bond markets and irregular mortgagor behaviors. A repeat of similar conditions is unlikely.

Investors should be aware of market valuations in addition to the fundamental valuation of REIT portfolios. The other reason for NLY’s steep decline in 2020 was fearful equity investors. As shown below, courtesy of Zacks, NLY’s price-to-book value fell from nearly 1.00 before the pandemic to 0.68 at the end of March 2020. Investors were fearful and discounted the stock by over 30% from its book value.

nly price to book value

There are additional risks as follows:

  • The current bull steepener ends as bond yields increase and the yield curve re-inverts. In such a scenario, book value would likely fall.
  • Leverage is easy to maintain when markets are liquid; however, in 2008, REITs were forced to sell assets and reduce leverage, negatively affecting earnings and dividends.
  • Management does not adequately hedge the portfolio.

Summary

Despite double-digit dividend yields in many cases and the cushion such high dividends provide, buying agency REITs is not a guaranteed home run in a bull steepener. That said, these firms offer investors a way to benefit from a steepening yield curve while avoiding an earnings slowdown that may hamper many stocks in an economic downturn.

The post Agency REITs For A Bull Steepener appeared first on RIA.

50 Basis Point Rate Cut – A Review And Outlook

Last week, the Federal Reserve made a significant move by cutting its overnight lending rate by 50 basis points. This marks the first rate cut since 2020, signaling the Fed is aggressively supporting the economy amid a backdrop of softening economic data. For investors, understanding how similar rate cuts have historically impacted markets and which sectors tend to benefit is key to navigating the months ahead.

In this post, we will explore the historical market performance following similar 50-basis-point rate cuts, highlight the best-performing sectors and market factors after such cuts, and outline three critical risks investors should be aware of heading into year-end.

Historical Outcomes To Rate Cuts

A 50-basis-point rate cut, especially the first one, is an aggressive action by the Fed. The Fed historically uses such a sizable cut during economic slowdowns or rising recession risks. Here are a few notable examples:

  1. January 2001: Following the dot-com bubble bursting, the Fed cut rates by 50 basis points in January 2001 to stabilize the economy. While the S&P 500 initially rallied, the broader market eventually experienced continued declines due to the deepening tech recession.
  2. October 2007: In the early stages of the Global Financial Crisis, the Fed implemented a 50-basis-point cut to inject liquidity into the system. As credit markets imploded due to an accelerating mortgage crisis, the immediate response from the stock market was positive, but the underlying financial instability resulted in prolonged market weakness throughout 2008.
  3. July 2019: The Fed’s most recent rate cut was in July 2019, responding to concerns about global trade tensions and an economic slowdown. Again, the market initially rallied, with the S&P 500 posting positive returns in the months following the cut. That period is notable because the rate cut was more of a precautionary measure, as the most recent rate cut seems to be, rather than a reaction to an existing economic downturn.

This is just an analysis of the Federal Reserve’s most recent rate cuts. Reviewing the history of rate-cutting cycles back to 1960 reveals some interesting points. The table below shows the 3-month average of the Effective Fed Funds Rate, the total decrease during a rate-cutting cycle, and related market outcomes or events.

Fed Rate Cuts Historical Outcomes

It is worth noting that while many analysts point to periods where the Fed cut rates and stocks initially rose over the next few months to a year, in many cases, those rate cuts preceded more significant events, as shown in the chart below.

Stock market vs Fed Funds Rate plus events

The 1995 Analogy

For example, many analysts point to 1995 as a similar period to today, when the Fed initially cut rates, and the market continued to rise without realizing a recession. However, a difference between 1995 and today is the inversion of the yield curve. In 1995, the yield curve never inverted, signaling a healthy economy. As shown, the yield curve did not invert until 1998, and the Fed resumed its rate cuts with a recession following in 2000, triggering the “Dot.com” crisis.

Percentage of yield curves inverted.

It is not unusual for investors to see an initial positive response in the short term as they welcome the Fed’s efforts to stimulate economic growth. Furthermore, prevailing bullish sentiment and momentum continue pushing higher asset prices. As shown in the table above, the primary determinant of whether the market experiences a significant correction or not hinges on a recessionary impact.

Historically, performance over a six-month to two-year period is primarily dependent on whether the rate cut successfully stimulates the economy or if deeper economic issues persist. For example, in 2001 and 2007, the six-month performance following the rate cuts was negative due to underlying economic challenges, while in 2019, the market continued to perform well until the onset of the pandemic-related economic shutdown.

Given this background, where should investors focus their attention?

Advertisement for portfolio management services offered by RIA Advisors.

Best-Performing Sectors and Market Factors

When the Federal Reserve reduces interest rates, in this case by 50 basis points, the decline in borrowing costs tends to benefit different sectors and asset classes in varying ways. While there are many options, here are five areas to start your research based on historical trends.

  1. Large-Cap Stocks: Large-cap stocks, and in particular, the “Mega-cap” stocks, tend to benefit the most immediately after a rate cut. With strong balance sheets and the ability to access cheaper capital, they can expand operations, boost profit margins, and, most importantly, buy back shares. Furthermore, these companies are highly liquid and benefit more from passive indexing flows than small and mid-cap companies.
  2. Small-Cap Stocks: Speaking of small-cap stocks, they tend to see a delayed response. These companies primarily use floating-rate debt; lower borrowing costs improve their financial strength. However, they are more sensitive to economic cycles, so recessions remain an important risk. Investors favor large-cap stocks, but small-caps may gain momentum once economic conditions stabilize.
  3. Treasury Bonds: Bonds tend to perform well during interest rate cuts. Bond prices typically rise as rates fall, providing investors with capital appreciation. Longer-duration Treasury bonds historically perform as lower interest rates drive demand for fixed-income assets.
  4. Real Estate Investment Trusts (REITs): REITs benefit significantly from rate cuts, as lower interest rates reduce borrowing costs for real estate acquisitions and development. Additionally, REITs provide steady income through dividends, which become more attractive as bond yields decline.
  5. Gold: Gold tends to perform well during an interest rate-cutting cycle when the economy slips into a recession and the dollar weakens. However, gold has already had a tremendous run in anticipation of the Fed’s most recent rate cut, so much will depend on the strength or weakness of the dollar and economic outcomes.

Factor Performance Prior and After the First Fed Rate Cut

Some Areas To Consider

With that information, and given the historical performance of various sectors and market factors following rate cuts, here’s how investors might consider positioning their portfolios:

  • Large-Cap Stocks: Focus on high-quality, large-cap stocks that can benefit from lower borrowing costs and have a strong track record of weathering economic uncertainty. Companies in consumer staples, technology, and healthcare tend to perform well in rate-cut environments.
  • Fixed Income: To capitalize on rising bond prices, consider adding exposure to long-term bonds or bond ETFs. Fixed-income investments provide stability and income, which can be particularly attractive in a low-rate environment.
  • REITs and Income-Producing Assets: Look for opportunities in REITs and other income-generating assets, which benefit from lower interest rates and provide reliable cash flow through dividends.
  • Small/Midcap CompaniesConsider selective exposure to small and mid-capitalization companies that have low debt levels and strong balance sheets and pay a dividend.

Ad for SimpleVisor. Don't invest alone. Tap into the power of SimpleVisor. Click to sign up now.

Three Key Risks for Investors Post Rate-Cut

While there are potential benefits to a Fed rate cut, there are also risks:

  1. Presidential Election: Given the disparity between the current candidate’s economic policies, particularly around tax rates and deficit spending, there is a risk of market participants derisking ahead of the outcome. One key issue to focus on is the outcome of the congressional races. A bifurcated outcome between control of the House and Senate would be most favorable for Wall Street as it would limit any drastic changes to current economic and regulatory policies.
  2. Economic Recession: As noted above, the most significant determinant between rate-cutting cycles, market corrections, and bear markets is the onset of a recession. The markets will likely respond negatively if upcoming data shows significant deterioration, particularly in employment and services-related data. In such an event, sectors such as financials and cyclicals are particularly vulnerable to prolonged economic downturns, as banks may face higher loan defaults and reduced demand for their services.
  3. Geopolitical Risks: Geopolitical tensions, particularly around trade, energy supply, or global conflicts, can exacerbate market volatility. External shocks such as escalating trade wars or energy supply concerns can weigh on investor sentiment and disrupt global markets even with lower rates. For instance, disruptions in the oil market or increased trade tensions with major economies could derail the positive effects of rate cuts.
  4. The Japanese Yen: In August, we discussed the impact of the “Yen Carry Trade” on the financial markets. That risk has not subsided, particularly should the Bank of Japan continue to hike interest rates while the rest of the world is cutting them. Such a move by the Bank of Japan would likely create another spike in the Japanese yen, creating another “margin call” for those highly levered positions held by Wall Street.

Japanese Yen

Conclusion: Navigating the Market Post-Rate Cut

The Federal Reserve’s 50-basis-point rate cut signals a proactive effort to support the economy amid potential risks. Historically, the S&P 500 and various sectors have responded positively to rate cuts in the short term, with large-cap stocks and bonds often leading the way. However, investors should remain cautious of risks such as the upcoming election, recession, geopolitical tensions, and the Japanese Yen that could impact market performance in the coming months.

At RIA Advisors, we remain allocated to the equity markets as momentum, relative strength, and the overall trend remain bullishly biased. However, we continue to regularly implement risk management protocols, evaluate opportunities, and closely watch the incoming economic data.

While everyone is trying to guess how this turns out, history suggests exercising some caution seems prudent. For us, it is always preferable to err on the side of caution. While it is easy to reallocate cash into equities, it is much more difficult to recoup losses.

Trade accordingly.

The post 50 Basis Point Rate Cut – A Review And Outlook appeared first on RIA.

Market Declines And The Problem Of Time

When stock markets rise, the bullish narrative tends to dominate, overlooking the potential impact of market declines. This oversight stems from two main problems: a basic misunderstanding of math and time’s critical role in investing. Every year, I receive the following chart as a counterargument when discussing the importance of managing risk during a portfolio’s life cycle. The chart shows that while the average bull market advance is 149%, the average bear market decline is just -32%.

So, why bother managing risk when markets rise 4.7x more over the long term than they fall?

Bull and Bear Markets over time measured in terms of percentage gain and loss.

As with any long-term analysis, one should quickly realize the most critical issue for every investor—time.

The Reality of Long-Term Stock Market Returns

Yes, since 1900, the stock market has “averaged” an 8% annualized rate of return. However, this does NOT mean the market returns 8% every year. As we discussed recently, several key facts about markets should be understood.

  • Stocks rise more often than they fall: Historically, the stock market increases about 73% of the time. The other 27% of the time, market corrections reverse the excesses of previous advances. The table below shows the dispersion of returns over time.

Average Returns Annual

However, to achieve that 8% annualized “average” rate of return, you would need to live for 124 years.

Time is the Investor’s Biggest Challenge

The average American faces a sobering reality: human mortality. Most investors don’t begin seriously saving for retirement until their mid-40s, as the cost of living during earlier years—college, getting married, having kids—consumes much of their income. Generally, incomes don’t exceed the cost of living until the mid-to late-40s, allowing for a serious push toward retirement savings. Most individuals have just 20 to 25 productive working years to achieve their investment goals.

Investment studies should align time frames with human mortality rather than focusing on “long-term” average returns. There are periods in history where real, inflation-adjusted total returns over 20 years have been close to zero or negative. Interestingly, these periods of near-zero to negative returns were typically preceded by high market valuations—as we see today.

Rolling 20 year returns of the market based on trailing valuations

Time and valuations are the most important factors for those just beginning their investment journey.

RIA Advisors advertisement for a conservative approach to portfolio management and investing services.

The Problem with Percentage-Based Returns

Another issue with long-term analysis is the misunderstanding of basic math, as we discussed in “Market Corrections.”

Charts often show percentage returns, which can be deceptive without deeper analysis. Let’s take an example:

If an index grows from 1000 to 8000:

  • 1000 to 2000 = 100% return
  • 1000 to 3000 = 200% return
  • 1000 to 8000 = 700% return

An investor who bought into the index generated a 700% return. According to First Trust, why worry about a 50% correction when you’ve just gained 700%?

However, the problem lies in the percentages. A 50% correction does NOT leave you with a 650% gain. It subtracts 4000 points from the index, reducing your 700% gain to just 300%.

Recovering those lost 4000 points to break even after a market decline is a much harder task. The real damage of a market decline becomes clear when we reconstruct the chart to display point gain/loss versus percentages. In many cases, a significant portion of a bull market’s gains are reversed by the subsequent bear market decline.

S&P 500 market returns by bull and bear cycle measured in point gain or loss.

While markets do recover, mainstream analysis often overlooks one key factor: time.

Market Declines Are A “Time” Problem. 

For most of us mere mortals, time plays a crucial role in our investing strategy. As shown in previous analyses, investors typically fall short of their expected outcomes when factoring in life expectancy and the time required for recovery from market downturns.

Below is a chart assuming a $1000 investment over each period and holding the total return until death. No withdrawals are made. The orange sloping line represents the “promise” of a 6% annualized compound return. The black line represents the actual outcome. In all cases except the most recent cycle starting in 2009, the invested capital fell short of the promised return goal.

The next significant downturn will likely reverse many of the gains from the current cycle, highlighting why using compounded or average rates of return in financial planning often leads to disappointment.

Real Total Return vs Life Span

At the point of death, the invested capital is short of the promised goal in every case except the current cycle starting in 2009. However, that cycle is yet to be complete, and the next significant downturn will likely reverse most, if not all, of those gains. Such is why using “compounded” or “average” rates of return in financial planning often leads to disappointment.

The reason is that market declines matter, and getting “back to even” is not the same as accumulating capital. The chart visualizes the importance of market declines by showing the difference between “actual” investment returns and “average” returns over time. The purple-shaded area and the market price graph show “average” returns of 7% annually. However, the return gap in “actual returns” due to market declines is quite significant.

Average versus actual retunrs

Ad for SimpleVisor. Get the latest trades, analysis, and insights from the RIA SimpleVisor team. Click to sign up now.

Why Time and Valuations Matter for Investors

Whether you’re five years from retirement or just starting your career, there are three key factors to consider in today’s market environment:

  1. Time horizon (retirement age minus starting age)
  2. Valuations at the beginning of your investment period
  3. Rate of return required to meet your investment goals

A buy-and-hold strategy may disappoint if valuations are high when you start investing, and your time horizon is too short or the required return rate is too high.

Mean reversion events often reveal the flaws of buy-and-hold investment strategies. Unlike a high-yield savings account, stock markets experience losses that can devastate retirement plans. (Ask any “boomer” who lived through the dot-com crash or the financial crisis.)

Investors should consider more active strategies to preserve capital during excessively high valuations.

Adjusting Expectations for Future Returns

Investors should consider the following:

  • Adjust expectations for future returns and withdrawal rates due to current valuation levels.
  • Understand that front-loaded returns in the future are unlikely.
  • Consider life expectancy when planning your investment strategy.
  • Plan for the impact of taxes on returns.
  • Carefully assess inflation expectations when allocating investments.
  • During declining market environments, reduce portfolio withdrawals to avoid depleting principal faster.

The last 13 years of chasing yields in a low-rate environment have created a hazardous situation for investors. It’s crucial to abandon expectations of compounded annual returns and instead focus on variable return rates based on current market conditions.

Conclusion: Don’t Chase the Market

Chasing an arbitrary index and staying 100% invested in the equity market forces you to take on more risk than you may realize. Two major bear markets in the last decade have left many individuals further from retirement than planned.

Retirement investing should focus on conservative, cautious growth to outpace inflation. Attempting to beat a random, arbitrary index with no connection to your personal financial goals is a risky game. Remember, in the market, there are no bulls or bears. There are only those who succeed in reaching their investment goals—and those who fail.


FAQ Section

Q: Why is risk management important in investing?
A: Risk management helps protect your portfolio from significant losses during market declines, ensuring you stay on track to meet your long-term goals.

Q: How do market declines affect long-term returns?
A: Market declines reduce returns; recovering from a decline can take years. This significantly impacts the overall growth of your portfolio, especially if time is a limiting factor.

Q: What is the best strategy during high market valuations?
A: During high market valuations, consider more active strategies and focus on preserving capital to minimize losses during market corrections.


Focusing on time, valuations, and proper risk management can help you better align your investment strategy with your financial goals and life expectancy.

The post Market Declines And The Problem Of Time appeared first on RIA.

Trump Or Harris: Corporate Tax Winners And Losers

Not surprisingly, Donald Trump and Kamala Harris are taking opposite approaches to modifying the corporate tax code. If enacted, both proposals would significantly impact corporate profits and, thus, share prices. Currently, the plans are only campaign promises. History repeatedly reminds us that many political promises are meant to drum up votes.

Read my lips, no new taxes” – George H.W. Bush 1988.

Predicting whether Trump or Harris will be the next president is challenging. Moreover, even if you know who will win, it’s even trickier to assess which legislation they will focus on and which bills can get through Congress.

Markets handicap unknown scenarios all the time. In some cases, stock prices can move violently as the odds of an event occurring change. Since corporate taxes may be the most significant short-term political factor affecting stock prices, it’s worth understanding what both candidates propose, allowing us to try and stay a step ahead of the market handicappers.

Furthermore, with the recent history of Donald Trump’s 2017 corporate tax cuts, we quantify which companies are best suited to take advantage of or be penalized by a change to the tax code.

Current Corporate Tax Code And History

The following graph charts the Federal corporate tax rate and the effective tax rate companies have actually paid since World War II. Trump’s 2017 Tax Cuts and Jobs Act (TCJA) reduced tax rates from 35% to 21%. The only other significant cut in America’s history of corporate taxes was in 1986, when President Reagan reduced them from 46% to 34%.

official and effective corporate tax rate

Like personal taxes, corporations have many loopholes. Thus, the effective tax rate can vary widely by company. Evaluating how tax rates affect corporate bottom lines in the aggregate is important but can be critical at a company level.

This article only addresses the proposals from the point of view of corporate profits. We do not opine on how they could impact the deficit or economy.

Ad for RIA Advisors portfolio management services. Conservative and disciplined approach for individuals nearing retirement.

Donald Trump’s Tax Proposals

Trump’s current tax proposal calls for a tax reduction for corporations from 21% to 15%. However, the reduction would solely be for companies that make their products in America. Companies that “outsource, offshore or replace American workers” will not be eligible.

What’s unclear is whether companies can divide their revenue for tax purposes based on where goods are manufactured. Furthermore, how will companies providing services be taxed?

Also for consideration is the “Bonus Depreciation” tax break from the 2017 TCJA. The legislation allowed companies to depreciate 100% of equipment purchases in the year it was acquired. Previously, they could only write down the value of equipment over time according to its useful life.

The Institute of Taxation and Economic Policy (ITEP) analyzed the impact of the accelerated depreciation rule on 25 of the biggest beneficiaries (LINK). They write:

The federal statutory corporate income tax rate is 21 percent, which means that if corporations enjoyed no special breaks or loopholes at all, they would pay 21 percent of their profits in taxes. As a group these corporations used many kinds of tax breaks to drive their effective federal income tax rate down to 12.2 percent. For the whole group of companies, accelerated depreciation accounts for 86 percent of those tax breaks.

Some corporations have used accelerated depreciation to drive their effective tax rates down to single digits during this five-year period. These include Verizon, Amazon, Walt Disney, Con Edison, General Motors, Dish Network, and others.

While the accelerated depreciation has been a boon to some companies, the amount a company can depreciate declines over time. In 2024, a company can only depreciate 60% of equipment costs versus 100% from 2018 to 2022. Each year forward, the amount drops by 20%. In 2027 and beyond, it will be phased out unless it’s extended.

Kamala Harris’s Tax Proposals

Harris’s proposal is more straightforward to analyze. She supports raising the corporate tax rate to 28% for all companies. In addition, she would like to increase the corporate stock buyback tax from 1% to 4%.

Under her plan, companies would see a 7% increase in tax rates which essentially claws back half of Trump’s 2017 TCJA tax legislation.

Congress ultimately has the power to change tax rates. Ergo, whether it is Trump or Harris, it will be hard to change the tax code if one of the two houses of Congress is the opposing political party. The chart below from Gavekal Research shows the possibilities.

corprorate tax proposals trump vs harris

Ad for The Bull/Bear Report by SimpleVisor. The most important things you need to know about the markets. Click to subscribe.

Analyzing The S&P 500 Companies

With some background on the candidate’s proposals, we now evaluate the constituents of the S&P 500 to assess the impact of the Trump tax cut. The analysis helps gauge which stocks are most at risk of tax hikes or could benefit from further tax reductions.

Our analysis is based on corporate tax data from 2010 to current for the 503 current S&P 500 stocks. To help improve the quality of the analysis, we only assessed companies with at least four years of earnings data before the Trump tax cuts and six years afterward. Further, we avoided companies with volatile earnings. That criteria narrowed the list to 306 companies.

Of this subset of the S&P 500, the average tax rate before the tax cut was 26.74%. Since then, it has been 17.37%. Almost 90% of the companies saw their effective tax rates decline. On average, the 306 companies’ earnings were 9.36% greater than they would have been.

We summarize the data for you because there are over three hundred companies.

The following table organizes the data by sector. Utilities were the apparent biggest beneficiary of tax cuts. This was partly from the bonus depreciation and recent tax incentives to promote green energy.  

On the other side of the coin is real estate. The cut was not meaningful because these companies tend to pay very little taxes. As shown, the rest of the sectors tended to gravitate around the average. 

tax cuts by sector

The following table shows the largest stocks by market cap. We left out five stocks due to earnings volatility.

tax cuts largest stocks

Who Pays If The Harris Plan Is Law

The following table lists the companies that saw an improvement of at least 20% to their bottom lines due to the 2017 change in the tax code. Some of these stocks may be at most risk if Harris’s tax plan to boost rates to 28% passes. Those with effective tax rates closer to 28% may be the least affected.

biggest boost from 2017 tax cuts

Part of the Harris plan is to raise the buyback tax rate from 1% to 4%. Doing so will weigh on the bottom lines of those perpetually buying back significant amounts of shares. Furthermore, some of these companies may find it more advantageous to increase their dividends instead of buybacks.

The following graph from Uptrends shows the top ten buyback programs of 2024. Clearly, Apple, META, and Google may have the most to lose from the potential tax increase.

largest stock buyback companies apple

Who Wins If Trump’s Plan Is Enacted

Conversely, those with the highest effective taxes and domestic production capabilities may benefit the most. Given that we do not have data on production facilities, we can only share the companies with the highest effective post-2018 tax rates.

highest tax payers

In addition to the potential tax cut, we must consider any changes to the bonus depreciation roll-off schedule. Trump could try to bring back the 100% depreciation in year one or stop the bonus depreciation percentage from declining.  

To help us in this endeavor, we share the following table from ITEP with the biggest beneficiaries of the bonus deprecation.

itep tax beneficiaries

itep tax beneficiaries

Ad for SimpleVisor. Get the latest trades, analysis, and insights from the RIA SimpleVisor team. Click to sign up now.

Summary

s&P 500 taxes

As we sit here today and assess the stock market and individual stocks from a political perspective, it appears a Trump victory may provide investors with more potential upside. We are solely basing the argument on their respective tax cut proposals.  

The graph above shows that the S&P 500 rocketed by 35% in the two months following the passage of the legislation. Furthermore, the market rose before the legislation as investors gained confidence the legislation would pass Congress.

One can argue the gains were short-lived, as the market gave up its gains shortly after. Contrarily, higher corporate profits due to lower tax rates are an important factor driving the market significantly higher since 2017.

The post Trump Or Harris: Corporate Tax Winners And Losers appeared first on RIA.

Momentum Investing Gives You An Edge, Until It Doesn’t

Since 2020, momentum investing has generated significantly better returns than other strategies. Such is not surprising, given the massive amounts of stimulus injected into the financial system. However, Brett Arends for Marketwatch noted in 2021 that momentum investing can give you an edge. To wit:

“Its success ‘is a well-established empirical fact,’ and can be demonstrated across multiple assets and over 212 years of stock market data, argues money manager Cliff Asness and his colleagues. It is ‘the premier market anomaly,’ writes analyst Gary Antonacci. It trounces a simple ‘buy and hold’ stock market strategy going back almost 100 hundred years, estimates money manager Meb Faber.”

While momentum investing is appealing in a liquidity-driven bull market, is it always the best strategy? As noted in the “Best Way To Invest:”

The last decade has been a boon for the index ETF industry, financial applications, and media websites promoting ‘buy and hold’ investing and diversification strategies. But is the ‘best way to invest’ during a bull market also the best way to invest during a bear market? Or, do different times call for different strategies?

That is the question we will explore further.

RIA Advertisement for conservative, investment and portfolio management services for high net worth investors

Momentum Investing Isn’t Passive

Brett compares several ETF funds over the past five years in his discussion. To simplify our analysis, we will use the following three ETFs from 2014 to the present. (2014 is the earliest date that all three ETFs have performance data.)

  • SPDR S&P 500 ETF (SPY) as the “buy and hold” proxy,
  • IShares Momentum ETF (MTUM) as the “momentum” proxy; and,
  • IShares Value ETF (IVE) as the “value” proxy.

For our analysis, we calculated the growth of $1 invested in each ETF from January 2014 on a nominal capital appreciation basis only.

At first blush, the obvious choice for investors was momentum when compared to the S&P 500 or value.

Growth of $1 in 3 market based ETFs

So, is that all there is to it?

Do you buy a “momentum” fund and forget about it?

Well, not so fast, says Brett. However, while I agree with Brett, it is for a different reason. The issue with “Momentum investing” is that it is not a passive strategy. For example, if we look at the top 10 holdings of MTUM, we can see the changes being made to the ETF as momentum changes in the market.

Snapshot of top-10 holdings of MTUM.

At the end of 2020, Danaher Corp (DHR) and Thermo Fisher (TMO) were among the top 10 holdings as the market chased healthcare-related stocks due to the pandemic. By September 2021, with the steepening yield curve and developments related to vaccines and bitcoin, Paypal (PYPL), Moderna (MRNA), and major banks dominated the top 10. By the end of 2021, PayPal was replaced by Nvidia (NVDA), Costco (COST), and accounting stocks.

Looking at the present, following the 2022 correction and subsequent rebound, the holdings have once again shifted. After a strong run in 2024, Costco has returned to the top 10, replacing Netflix (NFLX) and Microsoft (MSFT).

Snapshot of Momentum ETF holds in 2022

The outperformance in Momentum is due to the changes in holdings to capture price trends. However, if you hold SPY, the only changes over the last few years are due to the weighting in the top-10 holdings.

Snapshot of top-10 holdings of S&P 500 Market ETF 2021

Snapshot of top-10 holdings of S&P 500 Market ETF 2024

Again, momentum seems to be the obvious choice.

But it isn’t.

Ad for The Bull/Bear Report by SimpleVisor. The most important things you need to know about the markets. Click to subscribe today.

Momentum Investing Doesn’t Always Win

Brett makes a very important point about momentum investing.

Researchers say investing in so-called “momentum” stocks, is the best documented and most durable “edge” in the market.

Critically, that applies to owning individual equities in a portfolio. Not passively holding an ETF.

There is a difference.

Yes, on a passive basis since 2014, momentum has outperformed the benchmark and value indices. However, passively holding an ETF negates the value of momentum investing.

“And there is an inbuilt cautious bias to this portfolio as well, because it only holds stocks that have positive trailing returns. In a bear market you may be invested in nothing whatsoever. As Meb Faber and others have pointed out, momentum strategies can help you avoid the worst market turmoil.”Brett Arends

Read that again.

As a strategy, momentum investing raises cash when the momentum of holdings turns negative. Such is not the case for an ETF that must always remain invested. If we break the comparative performance down into specific periods, the value of the momentum strategy gets lost.

In 2105 and 2016, momentum provided no hedge against the Fed’s “taper” and Brexit.

Chart showing "Growth of $1 - S&P 500 vs. Momentum vs. Growth" with data from August 2015 to June 2016.

Similarly, in 2018, relative performance was worse than the benchmark during the Fed’s “taper tantrum.”

Chart showing "Growth of $1 - S&P 500 vs. Momentum vs. Growth" with data from January 2018 to December 2018.

Holding a momentum ETF in early 2020 did little to shield you from the downturn. However, momentum benefited from the recovery fueled by trillions in monetary and fiscal policies.

Chart showing "Growth of $1 - S&P 500 vs. Momentum vs. Growth" with data from January 2020 to December 2020.

During 2022, holding a momentum ETF significantly underperformed the value index.

Chart showing "Growth of $1 - S&P 500 vs. Momentum vs. Growth" with data from January 2022 to December 2022

As Brett noted, momentum investing’s value, when applied to a portfolio of individual equities, is that it can help avoid significant capital destruction during market downturns.

However, the value of the momentum strategy gets lost when applying an active strategy to a passive holding.

Ad for SimpleVisor. Get the latest trades, analysis, and insights from the RIA SimpleVisor team. Click to sign up now.

Choosing The Right Strategy At The Right Time

As a strategy, momentum investing works well when properly applied to a portfolio of individual securities.

One of the most interesting aspects of this portfolio though is not only that it has a lot of hard numbers backing it up, but that it is in theory accessible to any ordinary investor who can screen stocks by monthly performance.

He is correct, and it is something that we provide at SimpleVisor daily, as shown:

Simplevisor momentum based stock market screen

Momentum investing works exceptionally well during a strongly trending bull market. However, it is critical to remember that strategies change during a bear market. As shown below, market cycles tend to precede economic cycles, so investment strategies should change with both economic and market cycles.

Photo showing "Investing Cycles Rotate With Market Cycles."

Such will be critically important when the next bear market begins.

The Return Of Value

As Brett aptly concludes:

My biggest problem with “momentum” as an investment strategy is that you are basically abandoning any attempt to do your own fundamental analysis whatsoever. It feels to me like the stock market equivalent of “social” media, jumping on the latest crowd mania regardless of any merits. 

But maybe that’s why I should do it. If Rome is falling, and the Dark Ages are coming, shouldn’t I just give up and bet on the Vandals?”

I wouldn’t give up just yet.

The chart shows the difference in the performance of the “value vs. growth” index. (Fidelity Value Fund vs S&P 500 Index)

Value vs Growth relative market analysis

Notable are the periods when “value investing” outperforms.

While it may seem like the current bull market will never end, abandoning decades of investment history would be unwise. As Howard Marks once stated:

“Rule No. 1: Most things will prove to be cyclical.

Rule No. 2: Some of the most exceptional opportunities for gain and loss come when other people forget Rule No. 1.”

The realization that nothing lasts forever is crucial to long-term investing. To “buy low,” one must first “sell high.” Understanding that all things are cyclical suggests that investment strategies must also change.

The rotation from “momentum” to “value” is inevitable. It will occur against a backdrop of economic weakness and price discovery for investors quietly lulled into complacency following years of monetary interventions.

“Relative valuations are in the far tail of the historical distribution. If, as history suggests, there is any tendency for mean reversion, the expected future returns for value are elevated by almost any definition.”Research Affiliates

The only question is whether you will be the buyer of “value” when everyone else is selling “momentum?”

The post Momentum Investing Gives You An Edge, Until It Doesn’t appeared first on RIA.

Labor Market Impact On The Stock Market

The August jobs report highlighted a critical reality: the labor market is cooling off. While the headline figures seemed decent, the underlying data reveals clear warning signs that worker demand is slowing. Investors should pay attention because the link between employment and its impact on the economy and the market is undeniable. While often overlooked, as we will discuss, there is an undeniable link between economic activity and corporate earnings. Employment is the driver of a consumption-based economy. Consumers must produce first before consuming, so employment is critical to corporate earnings and market valuations. We will discuss these in order.

Consumer Demand Cycle

Slowing Labor Market: The First Red Flag

The August jobs report indicated that job creation has slowed dramatically, particularly in crucial manufacturing, retail, and services sectors. For months, we’ve relied on the narrative that a strong labor market could buoy the economy through rough patches. But that narrative quickly falls apart as hiring freezes and job cuts become more common. The data trend is always more critical than the actual employment number. The message is simple: employment is weakening.

However, as discussed in the “Sahm Rule,” full-time employment is a far better measure of the economy than total employment. As noted, the U.S. is a consumption-based economy. Critically, consumers can not consume without producing something first. As such, full-time employment is required for a household to consume at an economically sustainable rate. These jobs provide higher wages, benefits, and health insurance to support a family, whereas part-time jobs do not. It is unsurprising that, historically, when full-time employment declines, a recession typically follows.

Full Time Employment Annual Percent change

If full-time employment drives economic growth, it is logical that more robust trends in full-time employment are required. However, since 2023, the economy lost more than 1 million full-time jobs versus gaining 1.5 million part-time jobs. That does not scream economic strength.

Full-Time vs Part Time Employment

Furthermore, a comparison of full-time employment to the working-age population shows why the U.S. can not sustain annual economic growth rates above 2%.

Full Time Employment vs Working Age Population

Since the turn of the century, as the U.S. has increasingly integrated technology and outsourcing to reduce the need for domestic labor, full-time employment has continued to wane. If fewer Americans work full-time, as a percentage of the labor force, the ability to consume at higher rates diminishes as disposable income decreases.

Since corporate earnings depend on economic activity, companies continue to adopt technology and other productivity-enhancing tools to reduce the need for labor. If slower economic demand begins to weigh on corporate profit margins, earnings forecasts will be revised downward in the coming months.

Corporate Earnings Are in Jeopardy

Understanding how a weakening labor market translates into weaker earnings is essential. When companies are uncertain about future demand, they stop hiring and look to cut costs. These cost-cutting measures appear in numerous ways, such as layoffs, automation, outsourcing, or increasing temporary hires. Such measures can buy companies some time but don’t solve declining revenues. When fewer people have jobs or wage growth stalls, consumer spending slows down, and that hits the top line for many companies, particularly in consumer-driven sectors. Unsurprisingly, there is a relatively high correlation between the annual change in GDP and corporate earnings.

GDP vs Forward Earnings

As such, given that market participants bid up stock prices in anticipation of higher earnings and vice versa, the correlation between the annual change in earnings and market prices is also high.

Annual Change in earnings vs stock prices

In past economic cycles, we’ve seen how quickly earnings can disappoint when the labor market weakens. Analysts have been overly optimistic about earnings growth, and now the reality of slower consumer demand will force them to adjust their projections. As earnings expectations come down, investors will need to rethink current valuations. This is a straightforward equation—lower earnings lead to lower stock prices as markets reprice current valuations.

Market Valuations reflect in stock prices

Investors should prepare for a slowing labor market’s impact on stock prices. The market is a forward-looking mechanism, and it’s already starting to price in the effects of weaker job growth. Sectors most exposed to consumer spending, such as retail and travel, are likely to see the sharpest declines in stock prices as investors adjust to the reality of softer earnings.

Technology companies, which have driven much of the stock market’s performance this year, will also be vulnerable. These companies rely on high growth expectations to justify their lofty valuations. If the labor market weakens, consumer demand for tech products and services will also fall, leading to earnings misses and stock price declines.

Magnificent 7 valuations vs rest of market.

Ad for SimpleVisor. Get the latest trades, analysis, and insights from the RIA SimpleVisor team. Click to sign up now.

Investor Implications

The broader financial markets are potentially at risk of a “bumpier ride” as the effects of the weakening labor market ripple through the economy. As we’ve seen in previous cycles, investors will begin to move away from riskier assets like stocks and into safer investments such as Treasury bonds. Such a shift could exacerbate market volatility if earnings get revised lower to reflect slower economic activity.

There’s also the question of how the Federal Reserve will respond. A slowing labor market often leads to lower inflation, which might allow the Fed to cut interest rates more aggressively and reverse the current reduction in its balance sheet. However, if inflation remains well above the Fed’s 2% target, despite weaker job growth, the Fed could find its hands tied. A potential market risk is when the Fed gets forced to keep rates elevated while the economy slows. Such would prolong the economic downturn and increase stock price pressure.

Recent employment reports show a clear trend: the labor market is losing momentum. That spells trouble for the economy and the stock market. The slowdown in job creation, coupled with weaker corporate earnings, is setting the stage for increased market volatility.

As noted, with markets still near all-time highs, it is an excellent time to reassess portfolio risk exposures. Rebalancing positions in overvalued growth stocks and shifting toward more defensive assets could be prudent. As we have often said, capital preservation should be the priority in times of uncertainty. The labor market indicates that uncertain times are ahead, and investors should prepare accordingly.

The post Labor Market Impact On The Stock Market appeared first on RIA.

Scroll to Top